
Languages
Python · Go (Golang) · C · C++ · C# · Java · JavaScript · SQL · PHP
Software Engineer Systems Architect
Backend Engineering · Full-Stack · Data · Automation
I architect backend-heavy full-stack systems, APIs, data pipelines, and polished interfaces that make complex operations feel simple.
01 / About
I am a backend-focused software engineer who carries systems from data model and API design through deployment and high-craft UI/UX.
My work spans Python and Django services, REST integrations, SQL data systems, automation, Docker and Linux infrastructure, business intelligence, and responsive React and JavaScript interfaces. I focus on reliability underneath and clarity at the surface.
Through independent consulting, I have delivered full-stack applications, integrations, and automated digital systems for 20+ clients. That end-to-end ownership includes requirements, implementation, deployment, hosting, DNS, analytics, CRM integrations, performance, and the user experience.
02 / Technical stack
Backend engineering, data, infrastructure, automation, and UI/UX—applied across production work, research, and independent systems.
Python · Go (Golang) · C · C++ · C# · Java · JavaScript · SQL · PHP
Python / Django · Go · REST APIs · PHP · .NET · service integrations
MySQL · MongoDB · Power BI · DAX · data pipelines · visualization
Linux · Docker · Git · DNS · SSL/TLS · cloud hosting · observability
React · HTML5 · CSS3 · responsive systems · interaction · accessibility
CRM / SaaS · Zapier · PDF generation · OpenCV · ROS · technical SEO
03 / Featured work
Backend systems, data products, and polished client experiences—grounded in documented scope and measurable outcomes.
Backend platform / Data engineering
A React and Python/Django reporting platform that aggregated real-time data from 6+ external sources, normalized fragmented datasets through automated REST pipelines, and delivered adaptive dashboards plus consistent on-demand PDFs.
Read case study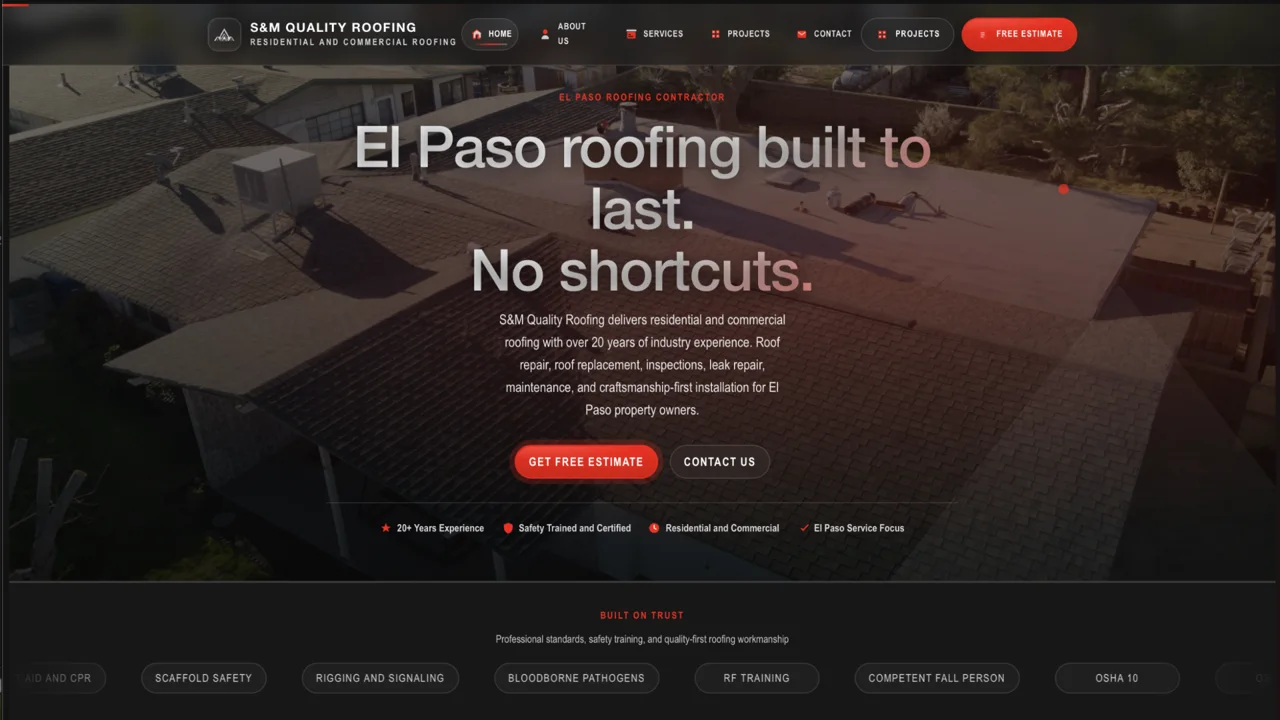 02
02Marketing system / Local growth
A complete marketing engine connecting the website, brand management, social publishing, SEO/AEO, Meta, and Google Ads to increase visibility and bring in leads.
Read case study 03
03Commerce / Connected operations
A complete storefront with cart, checkout, customer accounts, database and finance workflows, and an NDA-protected custom reporting engine.
Read case study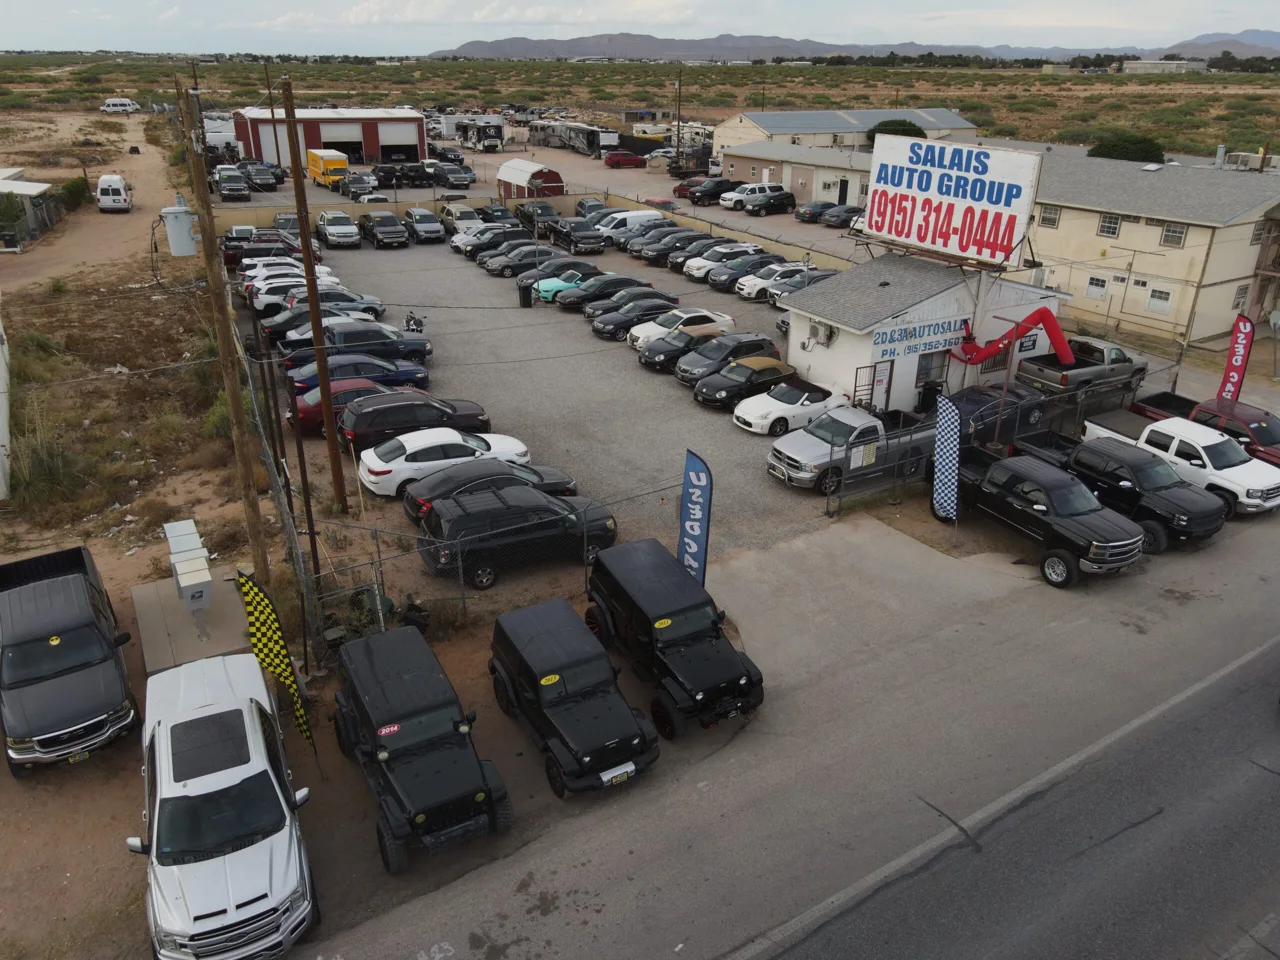 04
04Media system / Local visibility
Licensed Part 107 aerial production delivered in formats for short-form content, local marketing, and Google Business Profile use.
Read case studyFurther into the work
Software / Data platform
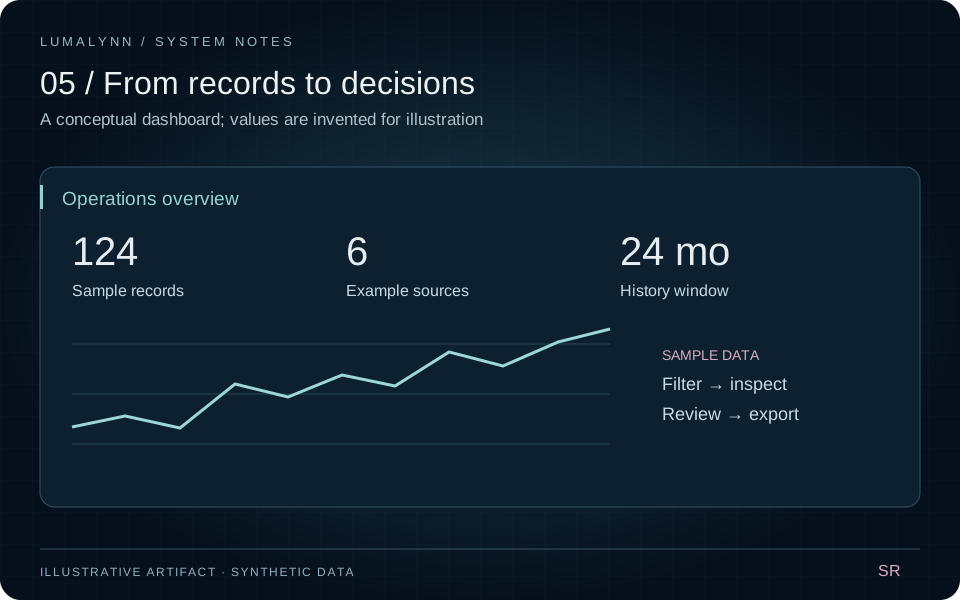
A full-stack reporting platform that brings external data, historical analysis, interactive dashboards, and on-demand documents into one workflow.
01 / Context
Reporting depended on assembling records from separate sources. Different data shapes made comparison difficult and recurring document preparation added manual work.
02 / Ownership
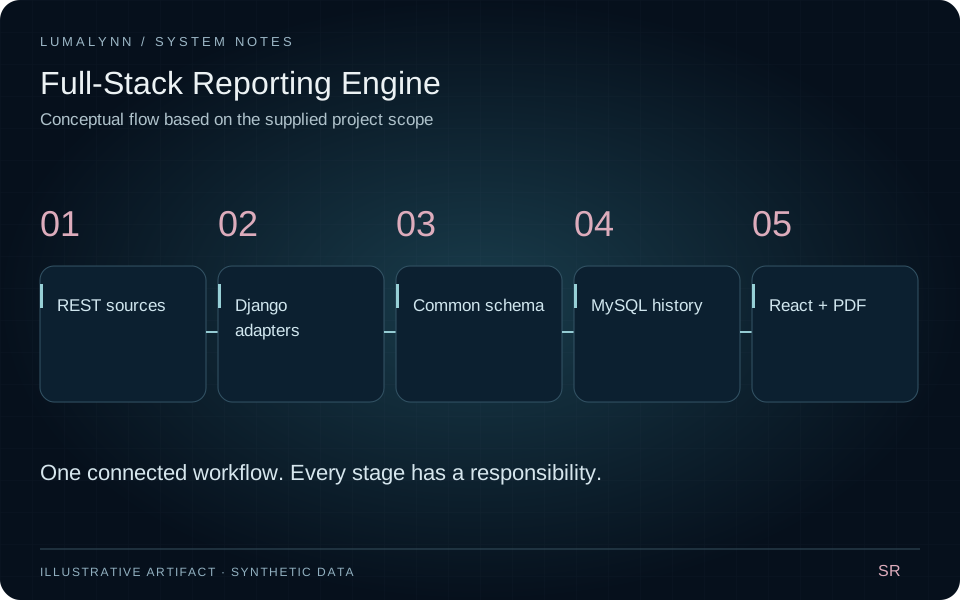
Lead developer and systems architect. Owned the React interface, Python/Django integration layer, REST pipelines, MySQL schemas, and PDF generation.
03 / Delivery
Integrated data from more than six external REST sources
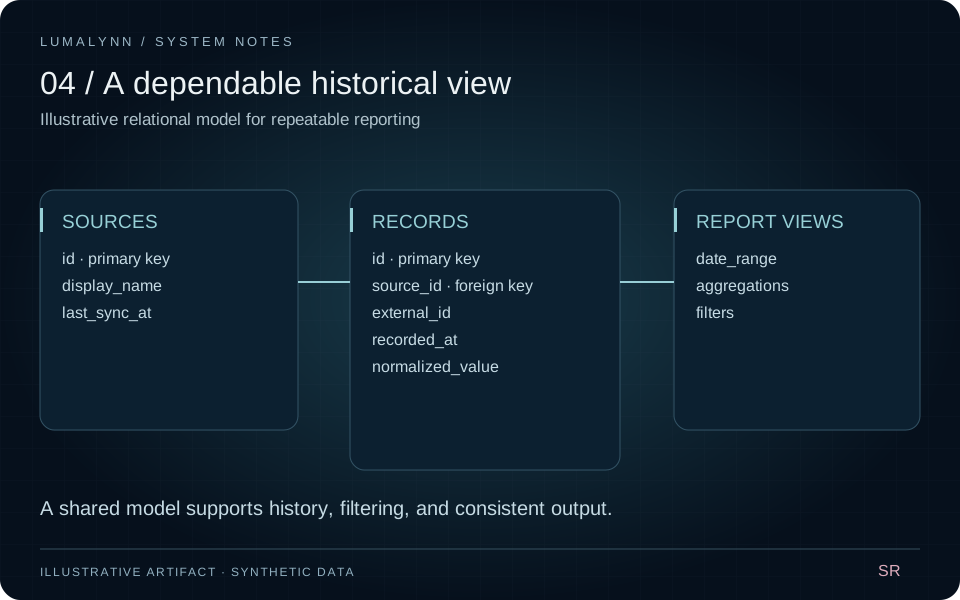
Normalized records into a common MySQL reporting model
Built interactive React visualizations with custom filters and two years of history
Added consistent PDF generation from the reporting dataset
04 / Approach
Keep integration and normalization concerns below the presentation layer so dashboards and documents share a dependable reporting model.
Approximately 50% less manual reporting effort, based on the operational estimate recorded in the résumé. The same data can be explored interactively and delivered as a document.
Source: September 2026 résumé; operational estimate, not an independent benchmark.“Having the dashboard and report in one workflow makes recurring reporting much easier to manage.”
Written from the supplied project scope and positive feedback reported by Seth. This is proposed wording, not a verbatim client quotation.
Client work / Marketing systems
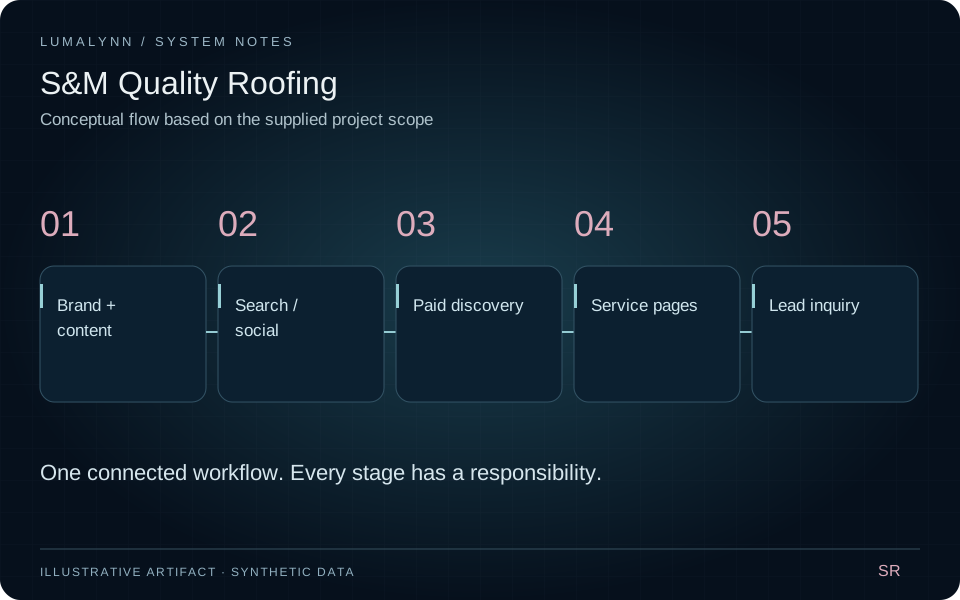
A website, search presence, social content, and paid advertising system built to help an El Paso roofing business become easier to find and contact.
01 / Context
A local service business needs a consistent presence wherever customers discover it: search, social media, advertising, and the website. Those channels need to lead to a clear next step.
02 / Ownership
Owned website delivery, brand management, social publishing, SEO and AEO, Facebook/Meta optimization, Google Ads, and the lead-generation experience.
03 / Delivery
Built a service-led website with clear estimate and contact paths
Aligned brand presentation and social-media publishing
Improved search and answer-oriented content for local discovery
Connected Facebook/Meta and Google Ads activity to the marketing presence
04 / Approach
Make each channel reinforce the same service story and direct interested visitors toward an inquiry, with consistent messaging throughout.
The completed marketing engine brought in leads and increased public visibility through coordinated social content, brand management, search optimization, and advertising.
Qualitative project outcome supplied by Seth Rodriguez. No numerical lead or revenue claim is made.“Our website, social presence, and advertising finally feel connected. The work gave our roofing business a clearer presence and helped bring in inquiries.”
Written from the supplied project scope and positive feedback reported by Seth. This is proposed wording, not a verbatim client quotation.
Client work / Commerce + operations
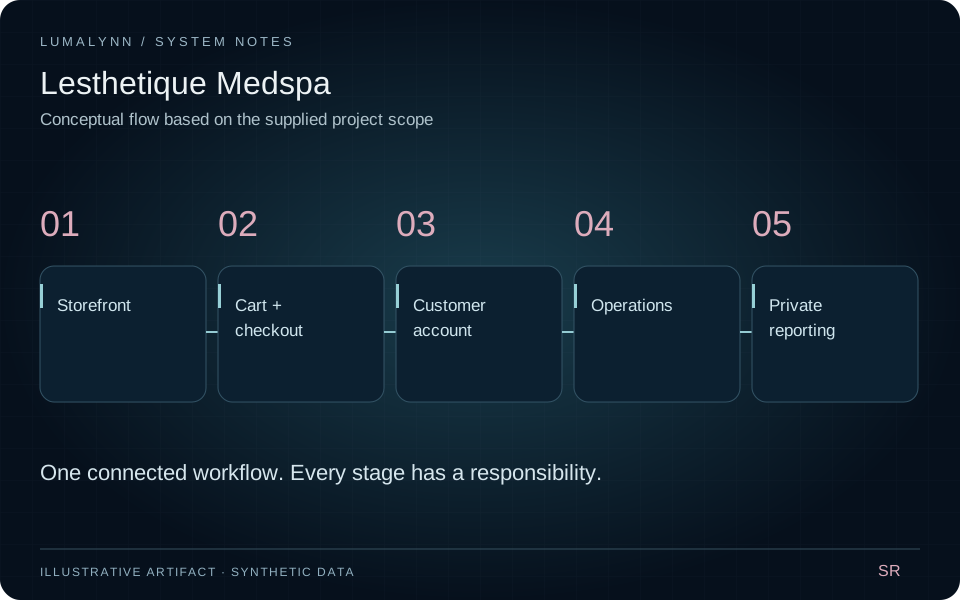
A customer-facing web experience supported by commerce, accounts, data management, finance workflows, and a custom reporting system.
01 / Context
The digital storefront needed to present a premium brand while supporting the practical steps behind shopping, customer accounts, and day-to-day operations.
02 / Ownership
Delivered the storefront website, cart and checkout integration, login/account management, database management, finance-related workflows, and a custom reporting engine.
03 / Delivery
Created a coherent storefront and customer journey
Integrated cart, checkout, and account-management experiences
Connected data and finance-related operational workflows
Developed custom reporting within an NDA-protected scope
04 / Approach
Connect the customer experience to the operational work behind it while maintaining a clear boundary around confidential reporting capabilities.
A complete storefront supported by connected account, data, and operational capabilities. Reporting details remain confidential under an NDA.
Scope supplied by Seth Rodriguez. Internal screens, customer data, financial details, and reporting logic are withheld.“The storefront feels cohesive and professional, and the connected account and operational workflows make the experience much more complete.”
Written from the supplied project scope and positive feedback reported by Seth. This is proposed wording, not a verbatim client quotation.
Client work / Aerial media
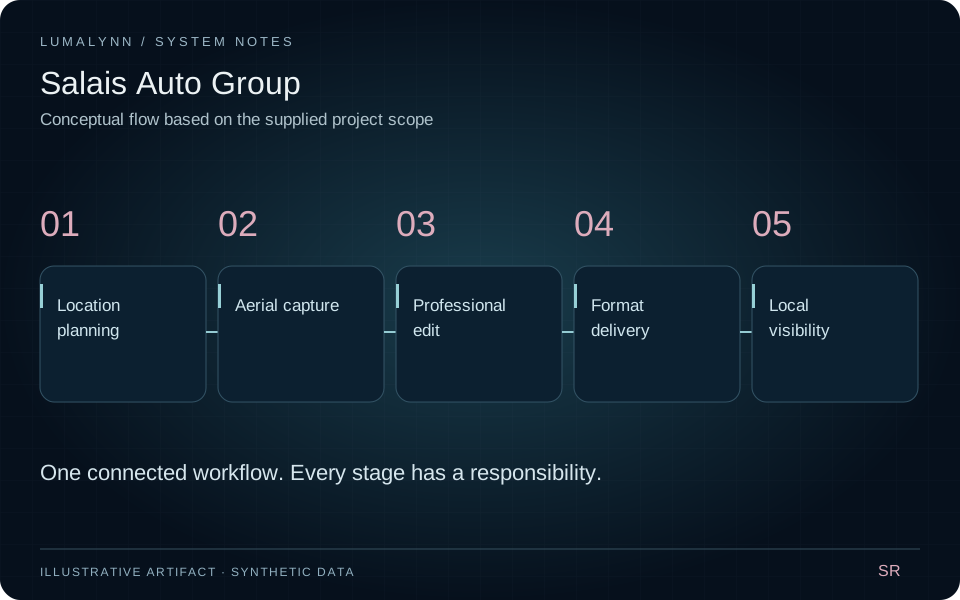
FAA-licensed drone production and professional editing turned aerial footage into polished assets for local marketing and digital discovery.
01 / Context
A dealership's physical presence is difficult to communicate through ordinary listings. Aerial media creates a broader view of the location and a stronger visual impression.
02 / Ownership
Owned licensed aerial production, professional editing, and preparation of media for short-form content, local marketing, and Google Business Profile use.
03 / Delivery
Captured aerial footage through FAA-licensed drone operations
Professionally edited the footage into finished marketing media
Prepared formats for short-form and local marketing channels
Delivered location-focused visuals with a consistent presentation
04 / Approach
Start with the real location and create finished assets suited to the channels where prospective customers encounter the business.
The project owner reports an approximately 20% increase in traffic associated with the delivered work. The traffic channel and comparison period were not specified.
User-supplied result; channel, time period, and independent attribution are not available.“The aerial footage gave our location a strong new perspective. The finished edits looked professional and were ready to use across our marketing.”
Written from the supplied project scope and positive feedback reported by Seth. This is proposed wording, not a verbatim client quotation.
Experience / Systems + automation
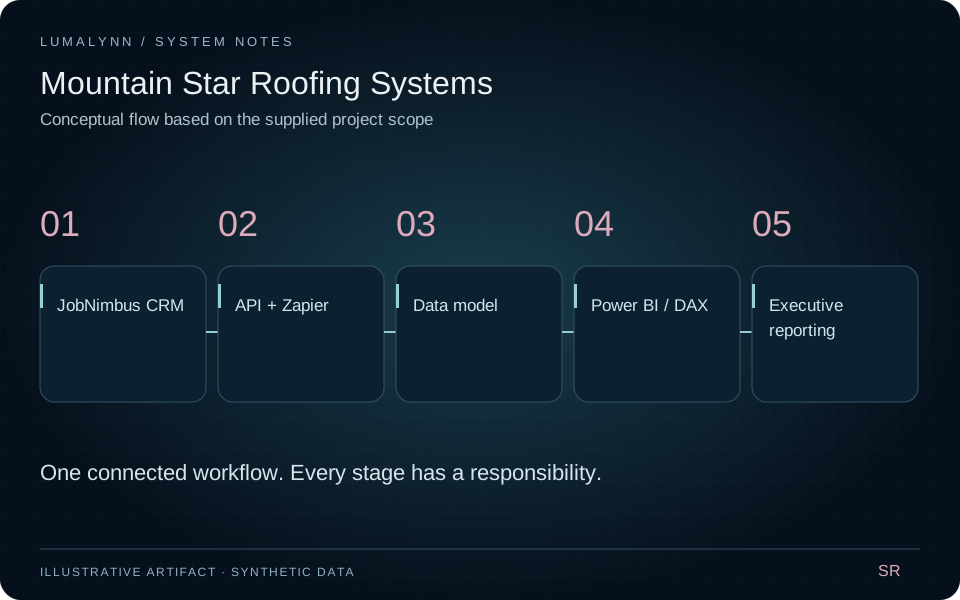
Power BI, CRM data, automation, and production infrastructure brought reporting and recurring operational work into a more connected system.
01 / Context
Executive reporting and recurring data work needed a dependable connection to operational CRM records and fewer manual handoffs.
02 / Ownership
Systems Director, September 2025–June 2026. Owned Power BI/DAX dashboards, JobNimbus integration, Zapier and API automation, and web/communications infrastructure.
03 / Delivery
Built Power BI dashboards with advanced DAX and live JobNimbus CRM data
Automated recurring workflows with Zapier and custom API connectors
Administered SaaS platforms, reporting tools, and operational data flows
Maintained DNS, SSL/TLS, hosting, and secure email configuration
04 / Approach
Connect reports to operational data and automate repeated handoffs, while keeping the underlying web and communication services dependable.
The résumé records a 50% reduction in executive reporting time, more than 20 manual hours eliminated each week, and 100% production infrastructure uptime during the stated role.
Source: September 2026 résumé. These are historical role outcomes, not future performance guarantees.“Connecting CRM data with reporting helped reduce repetitive work and made operational information easier to use.”
Written from the supplied project scope and positive feedback reported by Seth. This is proposed wording, not a verbatim client quotation.
Research / Computer vision
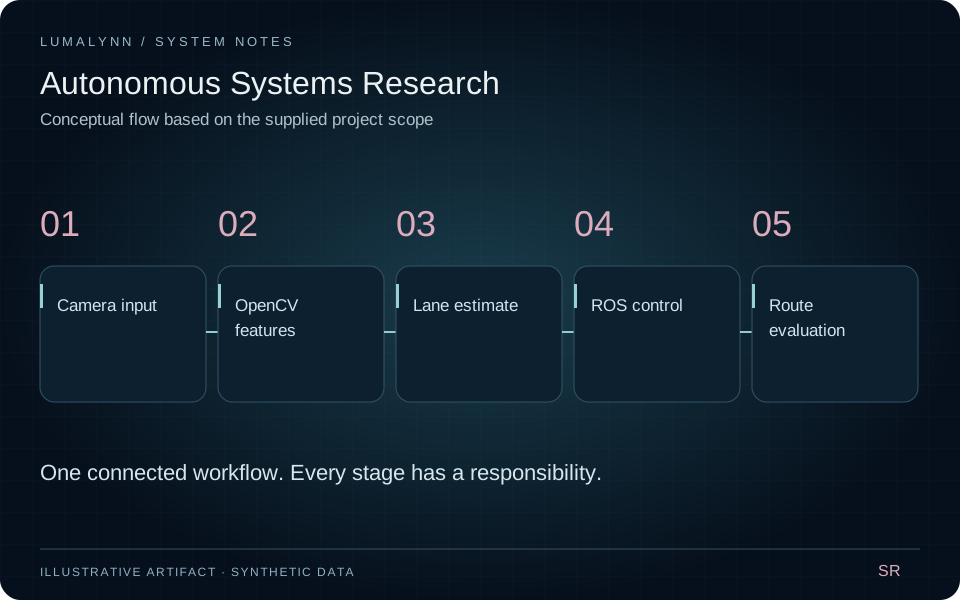
An autonomous-systems research internship exploring lane-following behavior through computer vision, simulation, and vehicle testing.
01 / Context
A Polaris GEM e2 needed a lane-following approach that could be developed in simulation and evaluated through on-road testing.
02 / Ownership
Autonomous Systems & Data Research Intern at Lawrence Technological University, May–August 2022. Developed and tested lane-following algorithms and co-authored a research paper.
03 / Delivery
Developed lane-following algorithms in C++ and Python
Used OpenCV and ROS for perception and system integration
Evaluated behavior in simulation and on-road testing
Co-authored a peer-reviewed paper published in MDPI Vehicles
04 / Approach
Use simulation and physical-route testing together to evaluate lane-following behavior and establish a benchmark for later research cohorts.
The résumé records 95% route accuracy in simulation and on-road testing, successful completion of the autonomous course, and selection as one of eight students from more than 1,000 applicants.
Source: September 2026 résumé. The full evaluation protocol and paper citation are not included in the supplied material.“The lane-following implementation gave the research team a concrete system to evaluate in simulation and on the course.”
Written from the supplied project scope and positive feedback reported by Seth. This is proposed wording, not a verbatim client quotation.
04 / Experience
January 2022 — Present
Independent Consultant · El Paso, Texas
Delivered custom full-stack applications, data integrations, and automated digital systems for 20+ clients while owning requirements, implementation, deployment, hosting, DNS, analytics, and CRM integrations.
September 2025 — June 2026
Mountain Star Roofing Systems · El Paso, Texas
Architected Power BI and DAX systems using live JobNimbus CRM data, automated reporting with custom API connectors, and administered the organization’s production web and communications infrastructure.
May 2022 — August 2022
Lawrence Technological University · Southfield, Michigan
Engineered and tested lane-following algorithms in C++ and Python with OpenCV and ROS for a Polaris GEM e2. The work achieved 95% route accuracy across simulation and real-road environments and contributed to a peer-reviewed MDPI Vehicles paper.
Education
The University of Texas at El Paso · Minor in Mathematics
A computer science and mathematics foundation supporting work across algorithms, backend systems, data engineering, automation, and human-centered software interfaces.
05 / Engineering approach
Find the real constraint behind the request.
Make the system, tradeoffs, and interfaces explicit.
Ship a simple, observable foundation first.
Test behavior, performance, and usefulness.
Remove friction and automate repetition.
Document the system and own the outcome.
The Japanese night artwork anchors a WebGL water surface, curved sakura geometry, and interactive systems. A responsive image preserves the composition before enhancement and in Static mode.
Semantic HTML remains usable before enhancement. Motion, dialogs, scroll-linked indicators, and advanced CSS activate only when the browser and visitor preferences support them.
Keyboard navigation, visible focus, live form status, and Full, Reduced, or Static effects modes keep the interface expressive without making animation a requirement.
The scene adapts its rendering resolution, shares repeated geometry, pauses when hidden, and provides a complete static fallback. Content and controls remain ordinary, accessible HTML.
06 / Contact
Tell me what you are building, where it is stuck, or what a better system needs to accomplish.
Open to software engineering opportunities and thoughtful collaborations.
Thanks for reaching out. I’ll respond as soon as I can.